Adapted with permission from: ESTCP, 2010, “A Low Cost Passive Approach for Bacterial Growth and Distribution for Large‐Scale Implementation of Bioaugmentation,” Project ER-200513, Washington, DC. www.serdp.org.
EMD Technology
Contacts
Joey Trotsky
Naval Facilities Engineering and Expeditionary Warfare Center
1100 23rd Ave
Port Hueneme, CA 93043
805-982-1258
CDM Smith
Ryan A. Wymore
720-264-1110
Naval Weapons Station Site 70 is the former National Aeronautics and Space Administration (NASA) Research Testing and Evaluation Area, which was a rocket engine test facility in Seal Beach, California. Past operations at the facilities reportedly included the use of trichloroethene (TCE) along with other contaminants. Currently groundwater is contaminated with TCE in the area of interest.
Sequential reductive dechlorination of TCE under anaerobic conditions is a well documented pathway to remediate TCE in groundwater. However, certain conditions are required for complete dechlorination to ethene. These conditions include groundwater geochemistry, presence of dechlorinating bacteria DehalococcoidesDehalococcoides is a genus of organohalide-respiring bacteria (for example, bacteria that use chlorinated solvents as metabolic electron acceptors) within the phylum Chloroflexi, in the domain Bacteria, and currently represented by a single species, Dehalococcoides mccartyi (Dhc). This species is the only one known with strains that dechlorinate dichloroethenes (DCEs) and vinyl chloride (VC) to ethene and inorganic chloride. (Dhc), and pH. Because very little dechlorination of TCE to degradation products cis-1,2-DCE (DCE), vinyl chloride, and ethene had occurred, it was apparent that the conditions required for complete dechlorination were not present. Geochemical data suggest that high sulfate concentrations may be limiting full anaerobic dechlorination of TCE to ethene, but there were also concerns that the Dhc presence was not strong enough for complete dechlorination.
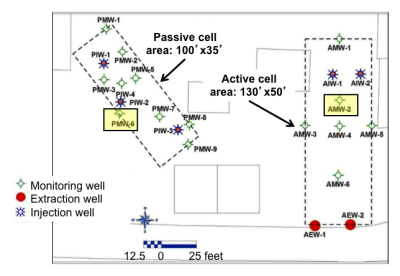
Figure A.5-1. Site location showing TCE concentration contours and passive/active treatment cells.
Source: Adapted from ESTCP 2010.
The Environmental Security Technology Certification Program (ESTCP) recently funded a study to evaluate passive and active approaches to bioaugmentationThe introduction of cultured microorganisms into the subsurface environment for the purpose of enhancing bioremediation of organic contaminants (USEPA 2011) to clean up the TCE contaminated groundwater. Analytical techniques were used to assist in the evaluation of the study included quantitative polymerase chain reaction (qPCR)A laboratory analytical technique for quantification of a target gene based on DNA. and carbon specific isotopeTwo atoms with the same number of protons but a different number of neutrons. analysis (CSIA). More details are available in ESTCP 2010.
The overall objective of this study was to compare bioaugmentation strategies using passive and active distribution approaches for chlorinated solvent contaminated groundwater. To support this objective, the following objectives required qPCR and CSIA to evaluate performance:
qPCR was used during three key phases of the demonstration: baseline monitoring, pre-conditioning, and post-bioaugmentation performance assessment. The use of qPCR during each phase is discussed further below.
During baseline monitoring activities, TCE was detected at concentrations up to 60,000 micrograms per liter (µg/L). However, intermediate products DCE, vinyl chloride, and ethene were either not detected or were less than 5% of the TCE concentrations. Additionally, although the groundwater geochemistry appeared relatively anaerobic, sulfate was detected between 1,000 and 8,000 milligrams per liter (mg/L). Lastly, qPCR analysis indicated that Dhc was not present in the study area in the majority of the samples collected. In the few areas where Dhc was present, only tceA was present at levels above detection but below reporting limits, while bvcA and vcrA were not observed.
These results indicated that high sulfate concentrations were likely limiting complete anaerobic dechlorination. Additionally, because the Dhc only contained tceA (which encodes enzymesAny of numerous proteins or conjugated proteins produced by living organisms and facilitating biochemical reactions (based on USEPA 2004a). to degrade TCE to vinyl chloride) and not bvcA or vcrA (which both encode enzymes to degrade vinyl chloride to ethene), the naturally occurring Dhc was not likely to perform complete dechlorination.
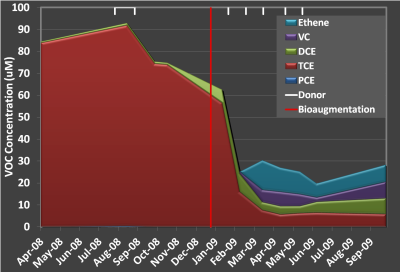
Based on these data, a “pre-conditioning” step was performed by adding sodium lactate to the study area to decrease sulfate concentrations and to create reducing conditions suitable for bioaugmentation. Figures A.5-2a-c show results of the pre-conditioning phase (prior to the bioaugmentation event shown by the vertical orange line). Although the pre-conditioning step was successful at creating highly reducing conditions and reducing sulfate concentrations (Figure A.5.2a), complete dechlorination was still not occurring (Figure A.5.2b). This result was expected, as qPCR results indicated that even after pre-conditioning, Dhc populations remained undetected or below 104 geneA segment of DNA containing the code for a protein, transfer RNA, or ribosomal RNA molecule (based on Madigan et al. 2010). copies per liter (Figure A.5-2c). Additionally, functional gene analysis indicated that even with the slight increase in Dhc populations after pre-conditioning, the functional gene vcrA was still not detected throughout the study area.
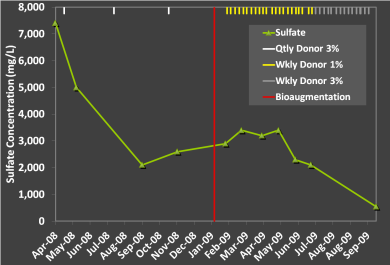
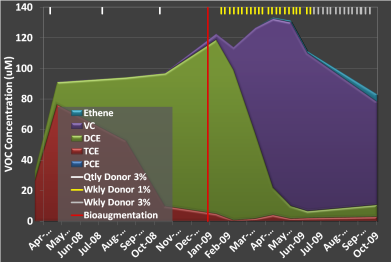
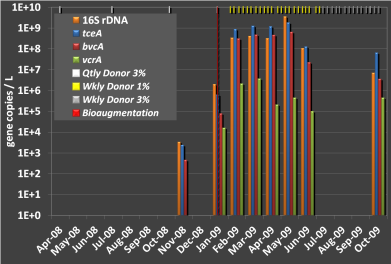
Figures A.5-2a-c from active cell well AMW-2 show decreased sulfate following initiation of pre-conditioning in April 2008. However, “DCE-stall” was observed until bioaugmentation in January 2009. qPCR results show that although Dhc started to appear by November 2008, populations remained low and vcrA was not present.
Source: ESTCP 2010.
Following pre-conditioning, injection wells were inoculated in January 2009 with commercially available Dhc culture SDC-9™. The use of qPCR and standard analytical techniques were used to evaluate the function of the bioaugmented culture in dechlorination.
qPCR was used to evaluate distribution of the bioaugmentation culture, including “first arrival,” as well as growth of Dhc over time. Results showed that the bioaugmentation culture had transport times similar to that of a conservative tracer, with the first detection of Dhc at monitoring wells two weeks following bioaugmentation. As shown in Figures A.7.2b-c (active cell) above and A.7.3 a, b below (passive cell), enhanced dechlorination and sustained elevated Dhc (with vcrA) populations were observed almost immediately following bioaugmentation. In both the active and passive cells, Dhc and functional gene populations increased 4-7 orders of magnitude, indicating that bioaugmentation using both approaches was successful to introduce a more effective culture with increased abilities to fully dechlorinate TCE.
 (1)/02000006_400x305.jpg)
Figures A.5-3 a, b from passive cell well PMW-6 show minimal dechlorination until bioaugmentation in January 2009. PMW-6 was 8 feet downgradient from injection wells and showed almost immediate Dhc presence. Additionally, since culture used had functional genes tceA and vcrA but no bvcA, these functional genes increased with Dhc but bvcA was no longer detected.
Source: ESTCP 2010.
CSIA was used along with the qPCR and dechlorination data to verify that dechlorination was occurring during the study and the plume was not being diluted or displaced by injection activities. CSIA data were consistent with the dechlorination data, in that they suggested degradation to vinyl chloride and ethene was occurring where VOC data suggest active dechlorination was occurring. An example CSIA chart is included as A.5.4 for PMW-6. This chart shows that TCE, c-DCE, and VC become enriched in the heavier isotope (13C) during the course of the demonstration, indicating degradation is occurring.
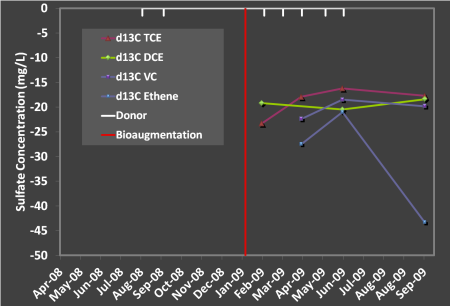
Figure A.5-4 CSIA Data
Source: ESTCP 2010.
The conclusions from this part of the site work include:
Costs for analysis of qPCR samples for Dhc and the three functional genes bvcA, vcrA, and tceA were $300 per sample for this demonstration project. However, this cost was based on the large number of samples required for this project. Costs for this analysis for a nonresearch-based project may range from $350-$400/sample.
ESTCP, 2010, “A Low Cost Passive Approach for Bacterial Growth and Distribution for Large‐Scale Implementation of Bioaugmentation,” Project ER-200513, Washington, DC.